
The world of investing is full of metrics and indexes. There are some everyone should know, and some that represent a specific perspective.
The fear and greed index is one of the indexes that not all investors use, but it is still one worth understanding. It was the invention of CNNMoney and was meant to put a metric on two of the most powerful emotions in investing.
In this article, we will cover:
- What the fear and greed index is
- The factors that go into the index (how it works)
- Arguments for and against the index
What is the Fear and Greed Index?
The fear and greed index is a tool that some investors use to gauge a market.
The ultimate purpose is to discover whether stocks are fairly priced. The logic is that those two forces, fear and greed, result in stocks trading at a price that doesn’t align with their intrinsic value.
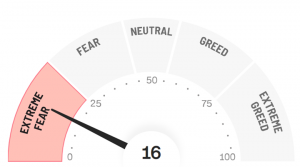
There are 7 factors that CNNMoney uses for their fear and greed index. Each of those factors is scored from 0 to 100. The fear and greed index is simply the weighted average of all of those scores. 50 is average, anything above 50 signals greed, and below that signals fear.
The fear and greed index is used for the S&P 500 and the NYSE. However, a crypto fear and greed index has also emerged and become more well-known in the cryptocurrency markets.
The score is meant to be a marker for, as CNN puts it, “what emotion is driving the market now?” To find out, they use the following 7 indicators.
The 7 Indicators of the Fear and Greed Index
1. Stock Price Momentum
First, look at the current market levels and compare them to the last few months’ performances. For example, if the S&P 500 is above its moving average for the last 125 days, it’s taken as a sign of positive momentum.
For the fear and greed index, slowing momentum signals fear, and growing momentum signals greed.
2. Stock Price Strength
The index covers the entire market, so it’s key to account for outliers that place too much weight in either direction. So, this metric focuses on the total number of stocks doing well versus those that aren’t.
The “Stock Price Strength” indicator lists the number of NYSE stocks that are at 52-week highs vs at 52-week lows. When there are too many highs versus lows, that is taken as a sign of greed and bullish sentiment.
3. Put and Call Options
When there is a change in the ratio of puts to calls, it’s taken as a sign of fear in the market. So, the indicator rises as the ratio of puts to calls rises. Bearish options ratios signal fear while bullish options ratios signal greed.
4. Stock Price Breadth
This indicator is the volume of shares listed on the NYSE that are rising versus how many are falling.
This indicator controls for the breadth of the stock market, as there are thousands of stocks traded every day.
If there are more rising than falling, the indicator will score higher.
If the number is low because the markets are bearish, that would signal fear, lowering the fear and greed index.
5. Junk Bond Demand
This indicator is the spread between yields for junk bonds and safer categories of bonds such as government bonds.
A wider spread is a signal of fear, whereas a lower spread is a signal of increased risk (counted as greed).
6. Market Volatility
There are actually existing metrics used to quantify market volatility. The one CNNMoney uses is based on the CBOE Volatility Index (VIX). The VIX measures expected price fluctuations in the S&P 500 for the next 30 days.
CNN’s measurement of market volatility tracks the VIX for a longer period. The indicator is scored lower when there is increasing market volatility, as more volatility is a signal for fear.
7. Safe Haven Demand
“Safe Haven” assets are those that people flock to when riskier investments prove volatile and unprofitable.
Strictly speaking, safe haven assets can include a range of assets at a given time. Gold and JPY can be included in some contexts. But this indicator of the fear and greed index compares stock versus bond demand.
Safe Haven demand (in this case) is the difference between treasury bond returns and stock returns for the last 20 trading days. Bonds perform better when there is fear in the market.
What’s Market Sentiment? How to Use Greed & Fear to Make Better Investing Decisions
Greed and Fear Index: Is it Really Useful?
There are points worth considering on both sides.
Benefits of the Greed and Fear Index (How to use it)
On the supporting side, fear is regarded by psychologists as a force that causes us to forgo common sense.
If the cerebral cortex is impaired by fear, thus impairing attention, perception, awareness, and thought processes. So, it’s both a scientifically solid indicator in this sense, as well as an understood force when it comes to money.
The school of behavioral economics provides most of the evidence that both fear and greed are significant when it comes to investment decisions.
Pundits have defended the greed and fear index as a useful tool. However, it’s widely understood that no one should place too much emphasis on this index alone.
More broadly, market sentiment alone isn’t solid ground for basing investment decisions. It can be embraced as a good indicator of fear in the market, which can be useful to investors.
Historically, the index has performed well as an indicator of significant changes in equity markets. However, it’s important to do more in-depth research into how the index correlates with market performance.
Drawbacks of the Greed and Fear Index
Unlike fear, there is no widely accepted research on the neurological affects of greed when it comes to money. Greed is certainly a powerful force, but it is disputable that its impact on investment (as used in this index) is well-grounded.
Many skeptics don’t discount the index altogether, but just place limits on its usefulness. Some see it as a barometer for timing, rather than an up-to-date indicator you should use as a research tool.
